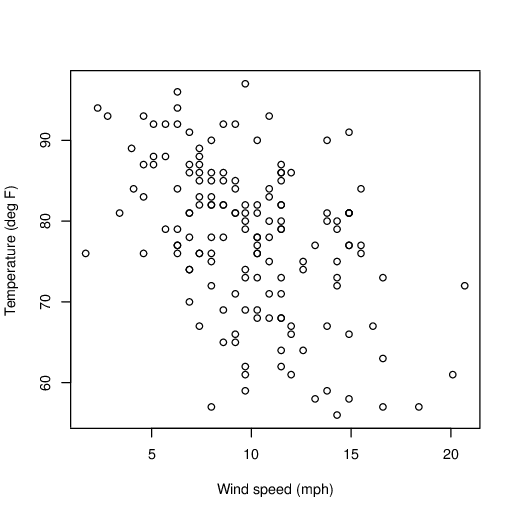
Figure 1: A scatter plot that will be converted to the SVG format.
Abstract
Many graphs created by statistical software are intended for experimental purposes, and are discarded without being printed. A number will be improved upon to make them fit for publishing. In either case, there is merit in making graphs available to blind people so that we can make the same sorts of decisions about these graphs as do our sighted classmates or colleagues.
All blind authors wishing to incorporate graphs into their work must learn how the graphs created by sighted authors are used to convey information. Provision of tactile images linked to textbook-type resources can show blind students what a particular graph does in a general sense, but blind authors must also learn what graphs generated from their own data will look like for a sighted audience.
This paper reflects on the attempts to use text descriptions and sound representations of graphs and shows what can be done to automate the process of turning a graph into a scalable vector graphic (SVG) or other file type ready for embossing. We demonstrate that this SVG can have the braille font automatically embedded so that there is minimal human engagement in the process of tactile image creation.
This work is part of the BrailleR project which is an extension to the R statistical software application. Like other functionality included in the BrailleR add-on package for R, the solution is simple for a user to include in their standard work practices. The tactile image process complements the text description that BrailleR has offered in the past.
The R Statistical Software application (R Core Team, 2015) has proven to offer more to a blind user than any other statistical software in common use today (Godfrey and Loots, 2014). The notion of an add-on package for R that supports blind users was first introduced by Godfrey (2012) and announced to the R community by Godfrey (2013). The BrailleR package (Godfrey, 2015) has been under development for the past four years and now offers blind users a range of tools that make their use of R even more effective.
The BrailleR package delivers text descriptions of some common graphics such as histograms and boxplots, but it is difficult to assess the extent of the benefits of these descriptions if blind users do not know how they compare with the actual image seen by their audiences. It is felt that this understanding can be attained through experience, but that at some point in their education blind students should be exposed to every different medium so that they can ascertain which is the most effective option for them as individuals. In addition, the most effective medium for learning in the short term may not be the most effective medium for use in everyday practice over the long term. Efficient and effective translation of statistical graphs into tactile formats is needed if every blind student is to be given this chance. This paper shows two solutions, both of which can be used by the blind student independently of sighted assistance.
Access to graphical representations of information from mathematical or statistical software is quite limited, and therefore limits the blind user’s capacity. To the authors’ knowledge, no widely-used mathematical or statistical software has the capability of directly linking to any hardware or software solutions that make the information presented in graphs immediately available to a blind user. The scalable vector graphic (SVG) format can be used to present a graphic with text embedded into the file for creating access for a blind user (Bulatov and Gardner, 2004; Gardner and Bulatov, 2010). Only a small number of statistical software applications have the capacity to create SVG files, but this capacity does not in itself create access because the text that makes them accessible must be added somehow; generally this is a manual process. The World Wide Web Consortium has a recommendation on the use of SVGs in web content (Dengler et al., 2011) and a number of add-on packages for R make use of SVG because of the opportunity to enrich a graphic’s interactivity in webpages; see Murrell and Potter (2014) for a more detailed discussion of these packages and their functionality. Of particular note is that there are different ways to create an SVG and care must be taken if the maximum accessibility for blind users is ever to be achieved.
In R, a graph can be saved as an SVG using the svg() command, but this approach uses the Cairo SVG format; this has the unfortunate outcome that text is not always preserved as a string, and some shapes are represented by an unstructured set of straight lines (Gardner and Bulatov, 2010). Retention of text as strings is crucial if modifications such as changing the font of any text to the braille font of a user’s choosing is to be managed easily. Use of the gridSVG package (Murrell and Potter, 2014) does lead to creation of SVG files that do keep strings of text intact and make use of a hierarchy of graphical elements. These SVG files are more easily modified to create accessibility for blind users that have the technology to interpret them (Gardner and Bulatov, 2010). Any graph created in R using functions from the graphics package will need to be converted to the grid package system for generating graphics through use of the gridGraphics (Murrell, 2015) package before they are exported in SVG format. Existence of the gridSVG and gridGraphics packages therefore makes creation and addition of the necessary text information to the SVG possible. This automation should assist in minimizing the need for human intervention.
Creation and augmentation of the SVG files has been evaluated using hardware and software from ViewPlus Inc.1 including the IVEO Touchpad, IVEO Creator, and IVEO Viewer. At this time, the need for the IVEO Creator software has been reduced to just one necessary act — the addition of a licence key to each SVG file so that a user can then view it using the IVEO Viewer software. In general, a user would emboss the SVG file and place the hardcopy on the touchpad for interaction with the content stored within the SVG. A ViewPlus Premier 100 braille embosser has been used for embossing the images during testing. These hardcopy images do not necessarily incorporate braille as they are intended to show the blind user what the sighted readers will see. Access to the printed words and labels on the graph are therefore gained by interaction with the touchpad; feedback comes via synthetic speech.
Blind people who do not have access to the IVEO hardware and software, but do have an embosser, can make use of another process which does replace all print with a braille version of the text. Use of this process is extremely dependent on the user’s ability to ensure they can get the most out of what their embosser has to offer with respect to tactile marks that are not braille letters. Some embossers are better than others; to date all testing has been done using the ViewPlus Premier 100 and EmBraille embossers, but attempts to make use of other brands are being investigated.
Until such time as use of tactile graphics for educational and professional use is commonplace, we may not truly know what is the best way to convey the information held within a statistical graph to blind users. Our initial aim was to show the blind user what their sighted audience is seeing in a graph, but we also wish for the tactile image to offer the same opportunity for exploration of data that is the principal reason for construction of many statistical graphs.
Use of the SVG should assist in meeting both of these aims; once a student has gained enough experience dealing with particular types of statistical graphs, they may then successfully rely on the embossed image alone. In the following code that generates Figure 1, there are only two commands that are extra work for the blind user wanting an SVG file to be created from the results of the standard R command being used by their sighted peers.
First, the BrailleR add-on package must be loaded (once per session) and then the SVGThis() command must follow the standard plotting command.
In this instance, the plot() command produces a graphics window that is captured and saved as an SVG file using the gridGraphics and gridSVG packages. The default SVGThis() command does little post-production processing, but if we can tell what sort of graph has been created it will be possible to improve the descriptions that are embedded in the SVG file.
The basic plot() command is one that will not readily lend itself to having dedicated functionality as it is too generic. The blind user might investigate a plot on the current graphics device using the WTF() command (What’s This Figure?) command from the BrailleR package. The output for this command when applied in an interactive R session where the scatter plot from Figure 1 is displayed is as follows:
There is likely to be further enrichment of the WTF() functionality to include more complete descriptions of the way each axis is presented, including the location of tick marks and the quantities labelled on them. The WTF() function can also look for other shapes used for plotting, such as rectangles used in histograms.
In addition, the blind user, having been told there were points on this graph, and having assumed that the graph is a scatter plot, might now find out where those points fall using the WhereXY() command from the BrailleR package. This would yield:
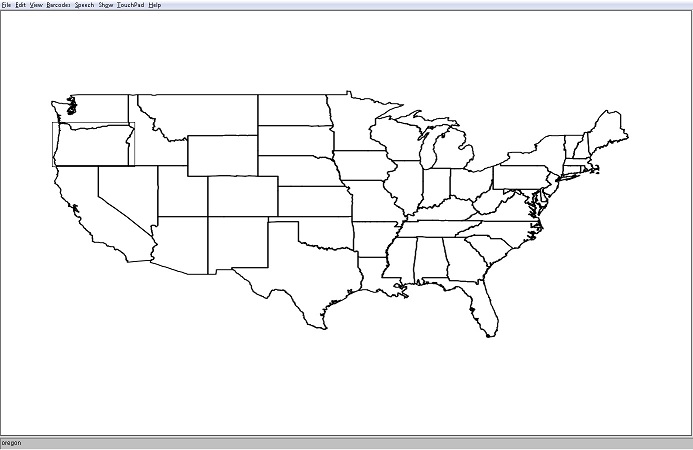
As an example of what can be embedded in an SVG file using an automated process, we now present a map of the lower 48 states of the USA. Each state is defined using a polygon for the borders that are printed, but the polygons are also used for the interactivity of the SVG. A user can put their finger within the region of any of the states and be told the name of the state being touched. It would be easy to then add a second (longer) description to the SVG so that the information needed for research can be sought once the user has found the state of interest.
Figure 2 shows a screen shot of the SVG being viewed in the IVEO Viewer software. The name of the state being selected is displayed in the bottom left of the screen. In this case, IVEO Viewer reads “Oregon” using synthetic speech.
Our experimentation shows that documents being prepared for a sighted audience using the R statistical application can be quite easily rendered in a tactile form for blind readers. This can be a simple hardcopy alone which features braille in place of printed text, or an SVG file that has been augmented for greater interactivity through use of a touchpad or similar hardware device. In so doing, we have improved the usefulness of this statistical software to a blind student or professional.
In addition, knowledge that a graph can be converted into either hardcopy braille or an SVG offers disability support staff an alternative workflow so that they can produce tactile graphics more efficiently. We expect use of tactile graphics to improve the educational outcomes for blind students and believe that we are addressing the need to produce them efficiently and effectively.
1ViewPlus Inc.’s products can be reviewed at www.viewplus.com
Vladimir Bulatov and John A. Gardner. Making graphics accessible. In SVG Open Conference, Tokyo, 2004. URL http://www.svgopen.com/2004/papers/SVGOpen2004MakingGraphicsAccessible/. September 7-10.
P. Dengler, D. Jackson, C. Lilley, J. Fujisawa, C. McCormack, E. Dahlstrm, A. Grasso, J. Ferraiolo, D. Schepers, and J. Watt. Scalable vector graphics (SVG) 1.1. W3C recommendation, W3C, second edition, August 2011. URL http://www.w3.org/TR/2011/REC-SVG11-20110816/.
John Gardner and Vladimir Bulatov. Highly accessible scientific graphical information through daisy svg. In Proceedings of the 2010 SVGOpen Conference, Paris, France, August 2010. URL http://www.svgopen.org/2010/papers/56-Highly_Accessible_Scientific_Graphical_Information_through_DAISY_SVG/index.html.
A. J. R. Godfrey. The BrailleR project. In Katsuhito Yamaguchi and Masakazu Suzuki, editors, Proceedings of Digitization and E-Inclusion in Mathematics and Science, pages 89–95, Tokyo, Japan, 2012. URL http://workshop.sciaccess.net/DEIMS2012/Proceedings.zip.
A. Jonathan R. Godfrey. Statistical software from a blind person’s perspective: R is the best, but we can make it better. The R Journal, 5(1):73–79, 2013. URL http://journal.R-project.org/archive/2013-1/godfrey.pdf.
A. Jonathan R. Godfrey. BrailleR: Improved Access for Blind Users, 2015. URL http://CRAN.R-project.org/package=BrailleR. R package version 0.23.5.
A. Jonathan R. Godfrey and M. Theodor Loots. Statistical software (R, SAS, SPSS, and Minitab) for blind students and practitioners. Journal of Statistical Software, 58, Software Review 1:1–25, July 2014. URL http://www.jstatsoft.org/v58/s01.
Paul Murrell. The gridGraphics package. The R Journal, 7(1):151–162, June 2015. URL http://journal.r-project.org/archive/2015-1/murrell.pdf.
Paul Murrell and Simon Potter. The gridSVG package. The R Journal, 6(1):133–143, June 2014. URL http://journal.r-project.org/archive/2014-1/RJournal_2014-1_murrell-potter.pdf.
R Core Team. R: A Language and Environment for Statistical Computing. R Foundation for Statistical Computing, Vienna, Austria, 2015. URL https://www.R-project.org/.