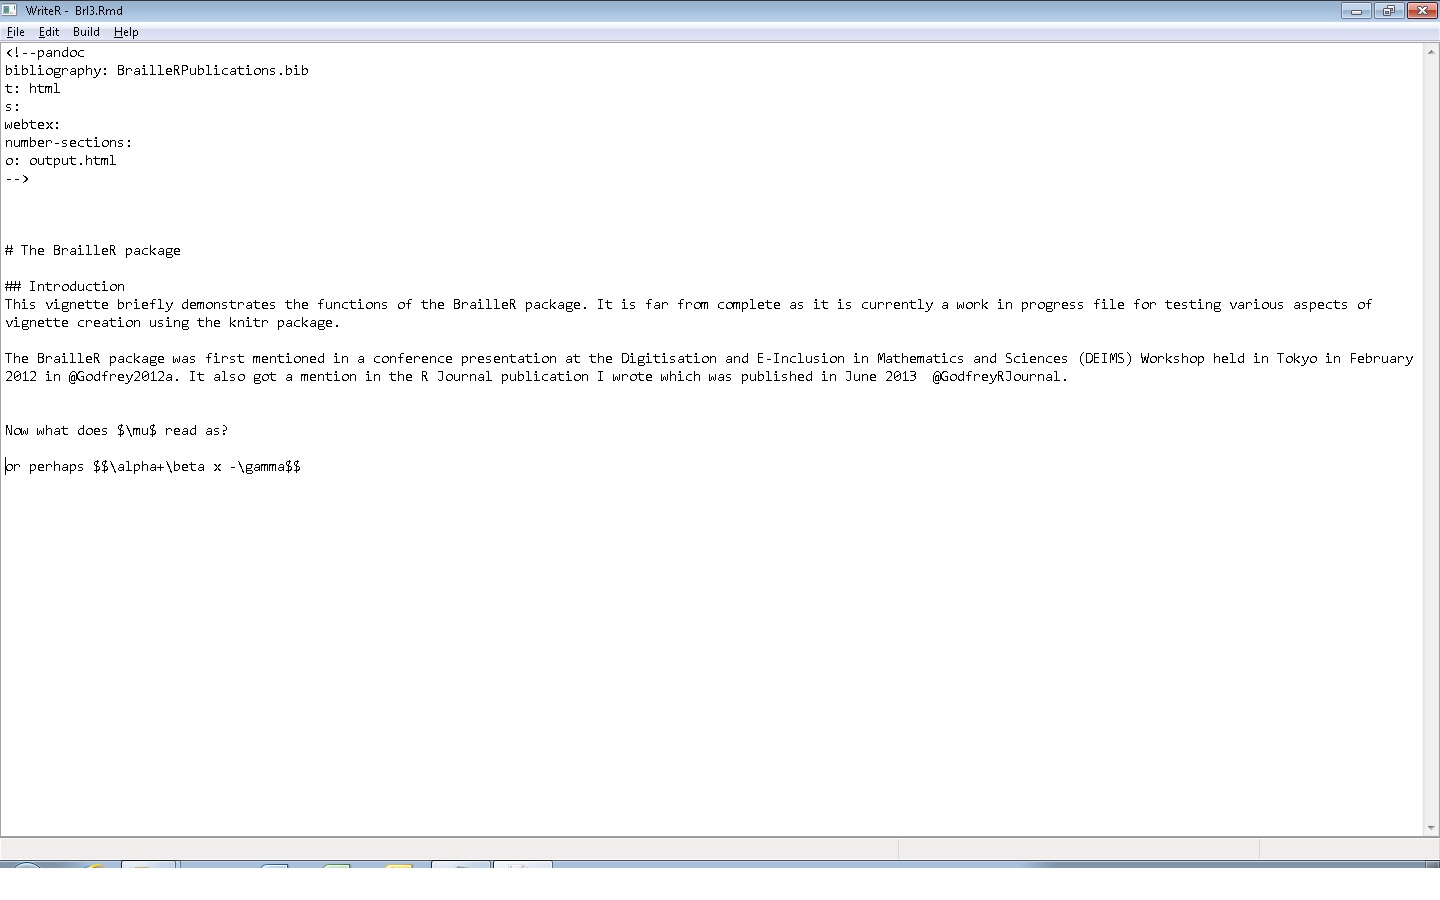
Figure 1: A screen shot of a document being edited in the WriteR application.
Abstract
Blind students and professionals need to be able to author documents quickly and reliably. Authoring systems such as LATEX and word processing software like Microsoft Word or Open Office can be used by blind authors very successfully, but these approaches have their advantages and limitations. A problem common to all of these options is that the blind author does not always have complete confidence that the outcome is correctly formatted to meet the expectations of the intended readership.
Markdown has become more commonplace as a tool for authoring online content, such as found on ‘wiki’ pages. It is valued for its simplicity and efficiency, but is therefore also quite limited in terms of the range of formatting flexibility. Under normal circumstances, a markdown source file is converted to HTML, meaning the resulting material is very accessible for screen reader users. There are several variants of markdown in common use today but their similarity is very high, as is the similarity of the resulting HTML.
A variant of markdown tailored to users of R statistical software has been developed and is receiving a great deal of use and ongoing development. The main drawback to its use is that the main tool being promoted for use of R markdown is inaccessible to screen reader users.
We demonstrate use of R markdown via a simple Windows application written in Python that gives the blind author an accessible editor for the source content so they can independently produce their own accessible final documents that contain statistical analyses.
Markdown is a simple markup language. The primary output document type is HTML, but use of pandoc1 means that one source markdown file can be processed into many different output document formats including HTML, Microsoft Word, pdf (via LATEX), Open Office, rich text format, and a variety of slide show presentation formats.
A variant of markdown has been developed for the R Statistical Software application (R Core Team, 2015). This has been achieved through development of a number of add-on packages, principally the knitr package (Xie, 2015), the rmarkdown package (Allaire et al., 2015), and their dependencies. R has proven to offer more to a blind user than any other statistical software in common use today (Godfrey and Loots, 2014). Combining the power of R with the ease of document preparation offered by markdown gives new workflow options to all R users. Blind people can benefit because we get the accessibility features we need with no extra effort as authors.
The single drawback to the use of markdown and R in combination is the inaccessibility of the primary integrated development environment (IDE) for R called RStudio2 (Godfrey, 2013). RStudio is a wonderful tool for sighted users, but there is very little chance that any effort will go into making it accessible. In most situations, the blind user is not missing much by not having RStudio available; the current exception is the absence of the ability to turn a markdown document with embedded statistical analyses into a beautiful final document. In response to this, we have developed a small text editor application in Python called WriteR, that meets this need for blind users. See Figure 1 for a screen shot of a document being edited in the WriteR application.
To prove the usefulness of the workflow discussed in this paper, the oral presentation accompanying this work has been developed using R markdown and the WriteR text editor; the presentation will also include a practical demonstration.
An R markdown document in its most simple form is just a markdown document with only two additional constructs. R content is added as part of a sentence, or as standalone blocks of R code input and associated output. A block of code looks like:
The first and last three characters are called ‘backticks’ in many documentation resources, but are known as accent grave symbols by screen readers such as JAWS (Freedom Scientific, 2015) and NVDA (NVDA Team, 2015). The other elements of the first line tell how the code block should be processed. The above example uses R to process the commands using default settings. ‘Example1’ is a reference for this block; other options exist for controlling the presentation of the input and output. This block has only one line of R code which is just a comment.
In comparison, the R markdown block:
has a request to suppress printing of the R commands. The result of this calculation would be printed out in the output document as it would appear in an R session window. More usefully however, the user can insert R commands in the prose of an article using a slightly different construct. To include the numeric representation for this mean in a sentence, the user would enter ‘r mean(x)‘ in the sentence.
Using these two constructs it is very easy to produce a document that can be updated on demand. Common scenarios that highlight the need to do this include tasks where data is updated over time leading to reports that depend on this data. In an educational setting, the opportunity for students to review their work and insert any additional tasks so that an analysis can be improved saves time and energy. This advantage is even more noticeable for blind students who often take longer to edit and perfect documents than do their sighted peers.
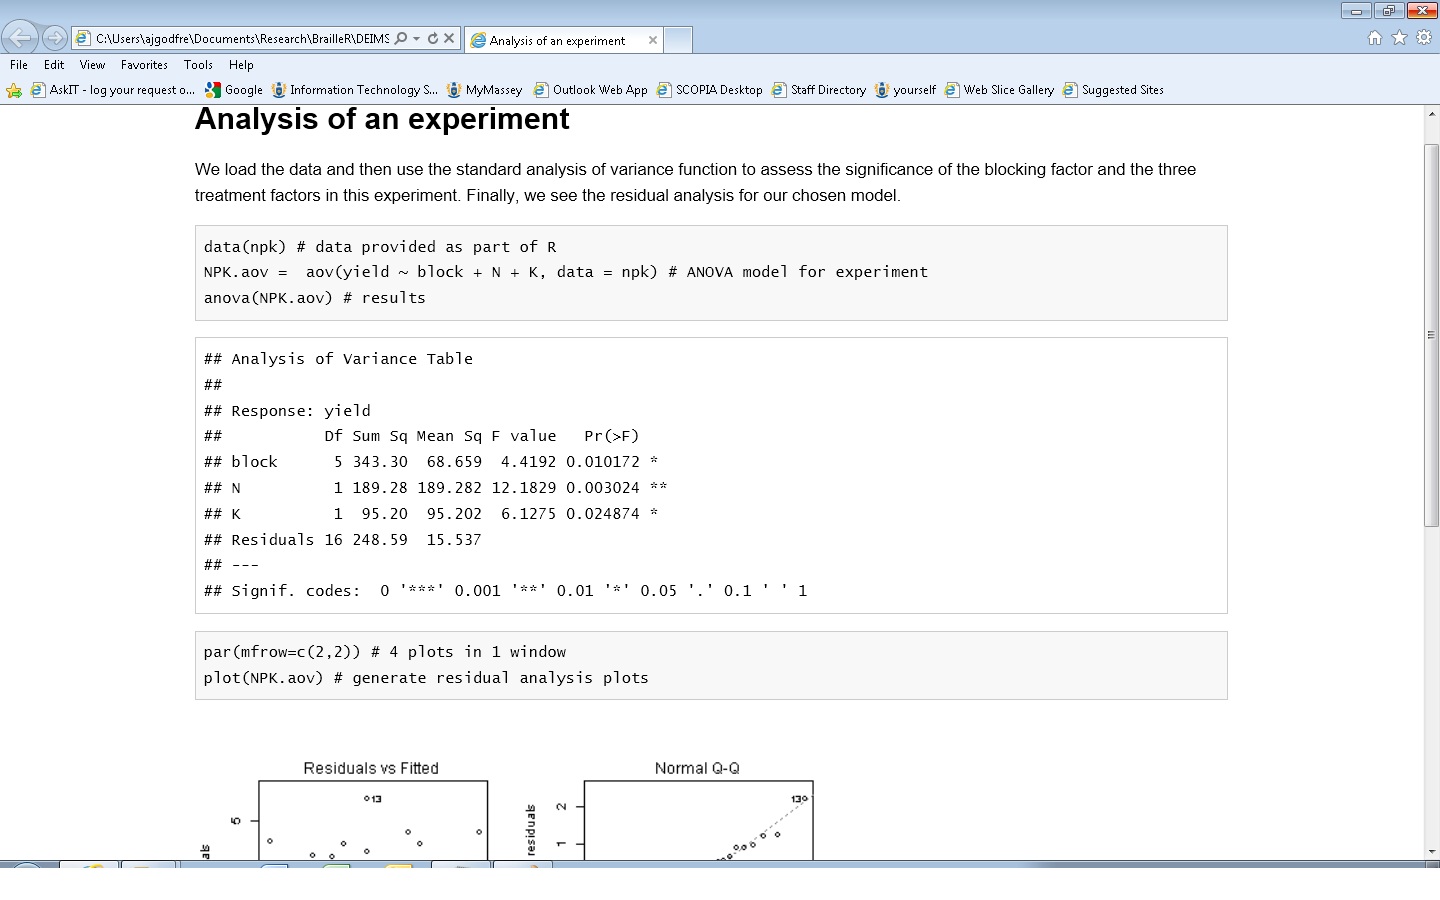
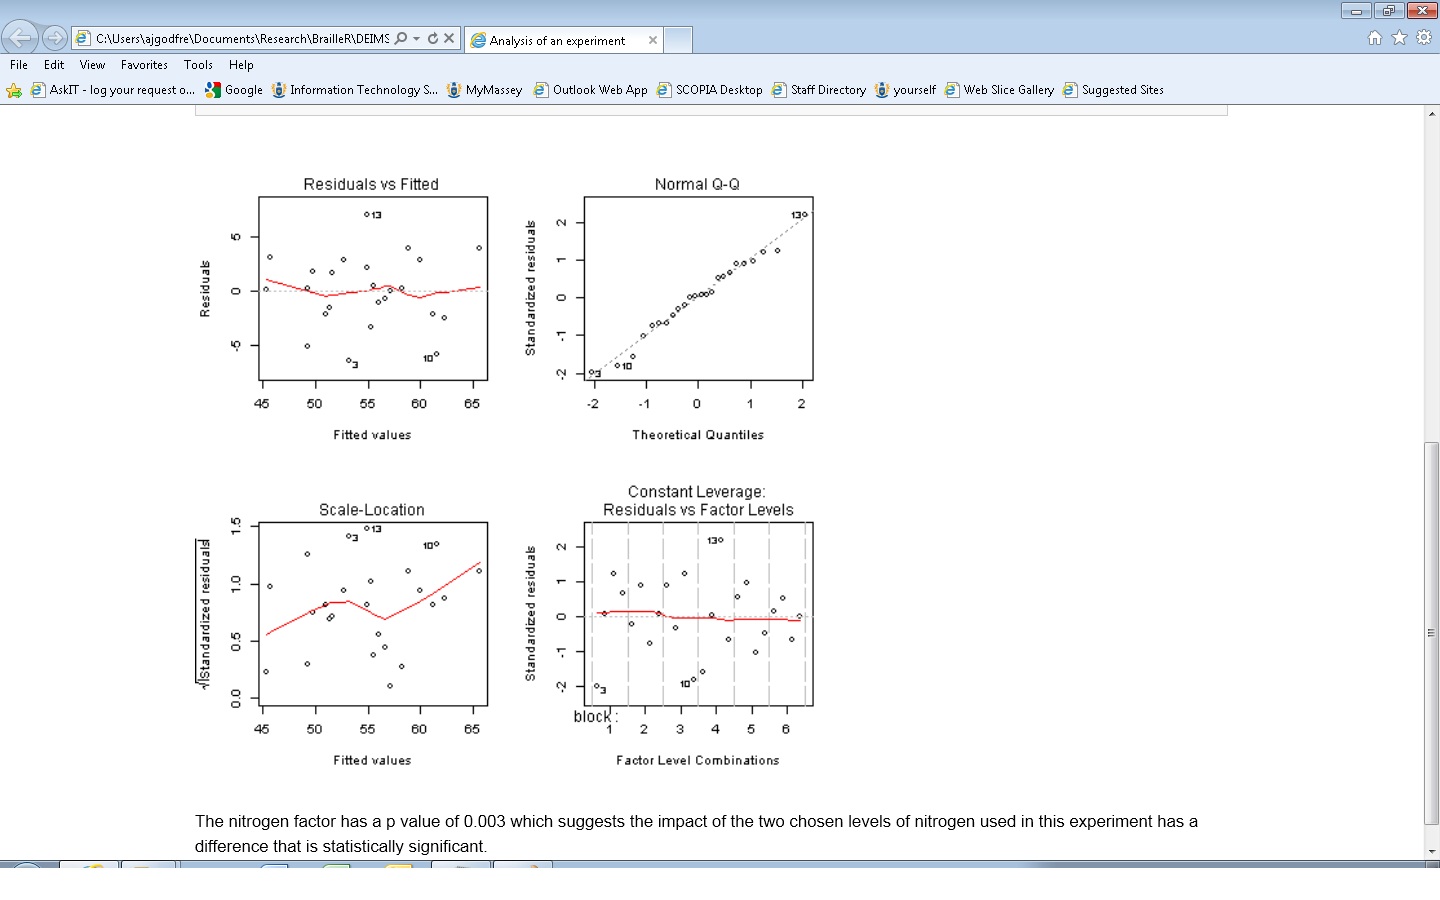
To illustrate how easy it is to create the solution for an assignment question, we process the R markdown document given in Figure 2 and present it as the screen shot of the HTML file being viewed in a browser (given in Figure 3).
The processing of this R markdown file into HTML used an intermediate markdown file (shown in Figure 4) which has included the statistical content from the execution of the R commands.
We have ensured that the WriteR interface is accessible for screen reader users. Testing has been undertaken using JAWS and NVDA screen readers. We have made use of hot keys for commonly used tasks and all menu items and dialogue boxes are accessible to blind users. All input for the R markdown documents can be entered using 8-dot computer braille with ease; users of 6-dot braille codes will have to overcome the challenges of typing various forms of brackets (parentheses, square brackets and curly braces) as well as a few symbols necessary for creating formatted content in their markdown documents. Standard (QWERTY) keyboards provide a completely accessible means of authoring all markdown documents.
The HTML documents that are created by processing R markdown documents are very accessible. Markdown incorporates use of heading levels and other simple formatting such as tables and bulleted or enumerated lists.
Mathematical content can be incorporated using MathML or MathJax, but there are reasons why these tools should be avoided. The most noticeable reason for wanting to avoid these means of presenting mathematical content is the need to add the relevant scripts into the header of all HTML documents which expands the size of the created HTML files. A smaller HTML file can be created that uses the same style of presentation as found on many webpages including http://www.wikipedia.com where mathematical content is produced using a graphic that has an alt tag containing the raw LATEX that created it. No matter which mode of presenting mathematical content is chosen, the user is constrained to a set of LATEX commands and environments and cannot develop their own LATEX commands.
The WriteR application is bundled with the BrailleR add-on package (Godfrey, 2015) for the R Statistical Software application (R Core Team, 2015).
Several functions for helping users get started with setting up WriteR and to start editing a document from their current R session have been incorporated into the BrailleR package. These functions include establishing default settings linking WriteR to the current version of R, incorporating the user’s name as the author of the R markdown document being edited, and offering suggested settings to build multiple output versions of the document as part of the document preparation process.
The use of the WriteR text editor as a means of creating R markdown documents has proven itself in a classroom setting during 2015. The first author has been able to type R markdown in front of a class and process the document into HTML for showing to students. Being able to demonstrate the use of R markdown and therefore show examples of how R can be used to achieve laboratory exercises in real time as against using pre-prepared documents creates a sense of authenticity that is important in the classroom setting.
1See the pandoc home page at http://johnmacfarlane.net/pandoc/
2See http://rstudio.com
JJ Allaire, Joe Cheng, Yihui Xie, Jonathan McPherson, Winston Chang, Jeff Allen, Hadley Wickham, Aron Atkins, and Rob Hyndman. rmarkdown: Dynamic Documents for R, 2015. URL http://CRAN.R-project.org/package=rmarkdown. R package version 0.8.1.
Freedom Scientific. JAWS Version 17. Freedom Scientific, St. Petersburg, FL, 2015. URL http://www.freedomscientific.com/.
A. Jonathan R. Godfrey. Statistical software from a blind person’s perspective: R is the best, but we can make it better. The R Journal, 5(1):73–79, 2013. URL http://journal.R-project.org/archive/2013-1/godfrey.pdf.
A. Jonathan R. Godfrey. BrailleR: Improved Access for Blind Users, 2015. URL http://CRAN.R-project.org/package=BrailleR. R package version 0.23.5.
A. Jonathan R. Godfrey and M. Theodor Loots. Statistical software (R, SAS, SPSS, and Minitab) for blind students and practitioners. Journal of Statistical Software, 58, Software Review 1:1–25, July 2014. URL http://www.jstatsoft.org/v58/s01.
NVDA Team. NVDA Version 2015.3, 2015. URL http://www.nvaccess.org/.
R Core Team. R: A Language and Environment for Statistical Computing. R Foundation for Statistical Computing, Vienna, Austria, 2015. URL https://www.R-project.org/.
Yihui Xie. knitr: A General-Purpose Package for Dynamic Report Generation in R, 2015. URL http://CRAN.R-project.org/package=knitr. R package version 1.11.