4.8 Making a Proportional Stacked Area Graph
4.8.1 Problem
You want to make a stacked area graph with the overall height scaled to a constant value.
4.8.2 Solution
Use geom_area(position = "fill"), as in Figure 4.23, left:
ggplot(uspopage, aes(x = Year, y = Thousands, fill = AgeGroup)) +
  geom_area(position = "fill", colour = "black", size = .2, alpha = .4) +
  scale_fill_brewer(palette = "Blues")
4.8.3 Discussion
With position="fill", the y values will be scaled to go from 0 to 1. To print the labels as percentages, use scale_y_continuous(labels = scales::percent), as in Figure 4.23, right:
ggplot(uspopage, aes(x = Year, y = Thousands, fill = AgeGroup)) +
  geom_area(position = "fill", colour = "black", size = .2, alpha = .4) +
  scale_fill_brewer(palette = "Blues") +
  scale_y_continuous(labels = scales::percent)
#> This is an untitled chart with no subtitle or caption.
#> It has x-axis 'Year' with labels 1900, 1925, 1950, 1975 and 2000.
#> It has y-axis 'Thousands' with labels 0.00, 0.25, 0.50, 0.75 and 1.00.
#> There is a legend indicating fill is used to show AgeGroup, with 8 levels:
#> <5 shown as white fill,
#> 5-14 shown as bluish white fill,
#> 15-24 shown as very pale blue fill,
#> 25-34 shown as very light greenish blue fill,
#> 35-44 shown as light blue fill,
#> 45-54 shown as brilliant blue fill,
#> 55-64 shown as strong blue fill and
#> >64 shown as strong purplish blue fill.
#> The chart is an area graph that VI can not process.
#> It has colour set to black.
#> It has size set to 0.2.
#> It has alpha set to 0.4.
#> This is an untitled chart with no subtitle or caption.
#> It has x-axis 'Year' with labels 1900, 1925, 1950, 1975 and 2000.
#> It has y-axis 'Thousands' with labels 0%, 25%, 50%, 75% and 100%.
#> There is a legend indicating fill is used to show AgeGroup, with 8 levels:
#> <5 shown as white fill,
#> 5-14 shown as bluish white fill,
#> 15-24 shown as very pale blue fill,
#> 25-34 shown as very light greenish blue fill,
#> 35-44 shown as light blue fill,
#> 45-54 shown as brilliant blue fill,
#> 55-64 shown as strong blue fill and
#> >64 shown as strong purplish blue fill.
#> The chart is an area graph that VI can not process.
#> It has colour set to black.
#> It has size set to 0.2.
#> It has alpha set to 0.4.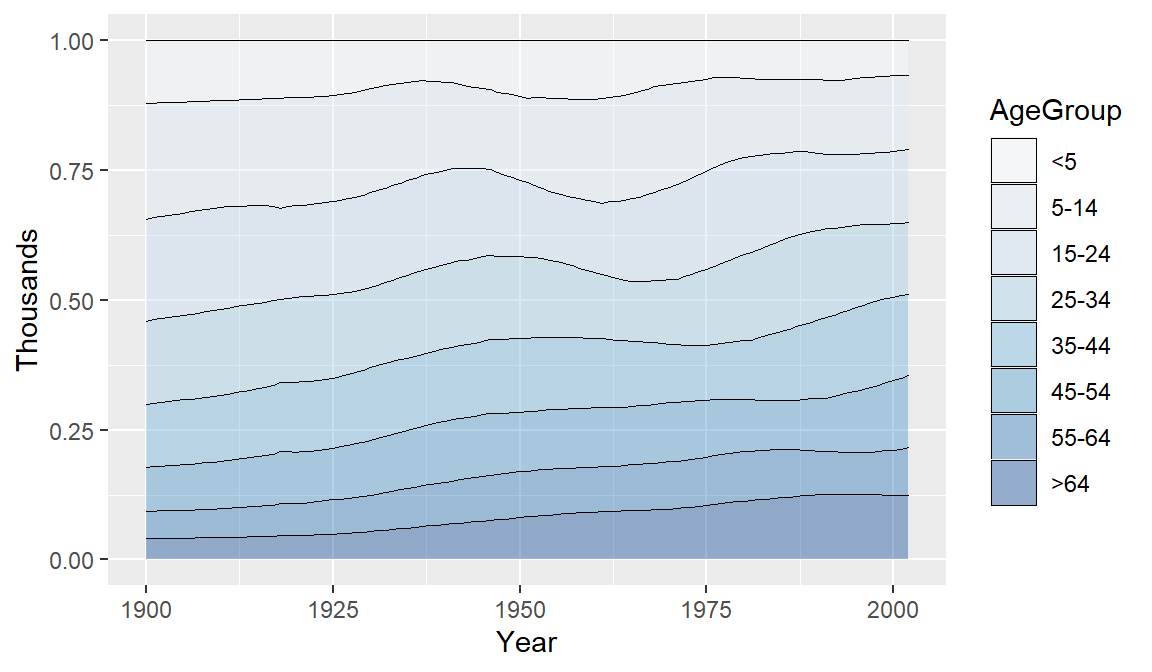
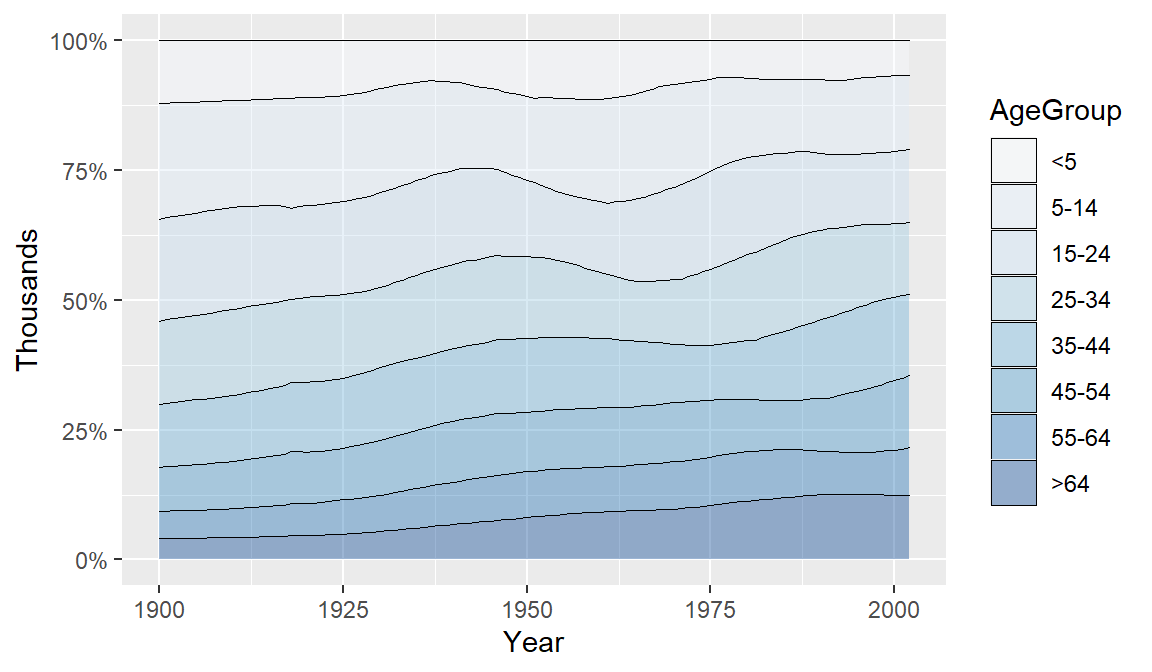
Figure 4.23: A proportional stacked area graph