Lecture 1 Paper Overview
This lecture provides an overview of 161.251.
This course is all about using regression models.
These models seek to describe the variation of one variable in terms of one or more others, so far as this is possible.
These models are a vital tool in the application of statistics.
1.1 Prescription
(as updated for the 2022 offering)
Common data analysis and regression techniques for application in science, business and social science. Topics include simple and multiple regression; linear models with categorical explanatory variables; model diagnostics; inference for linear models; polynomial regression; models for time dependence; methods for variable selection; non-linear and weighted regression.
1.2 Learning Outcomes
Students who successfully complete this course should be able to:
- Explore and describe characteristics of quantitative and categorical data and interrelationships among variables.
- Develop appropriate regression models for data analysis, make inferences about the model parameters, and interpret these in context.
- Critically assess whether a regression model adequately describes how one or more explanatory variables affect a response variable, and propose alternative approaches.
- Create and explain analysis of variance tables, and use them to test hypotheses about model parameters.
- Compare regression models and select a subset of explanatory variables that explain variation in a response.
- Use suitable statistical software to explore data and apply regression models.
N.B. For this course the “suitable statistical software” is R. Even if you have used R before, you may wish to review some introductory material to refresh yourself. If you have not used R before, then there is some extra work to do, but we won’t use this software in the first few lectures so there is still time to allow you a decent chance to catch up. Look for links on Stream, including how to get R and RStudio set up for this semester.
1.3 Some of the new Stuff You’ll Learn
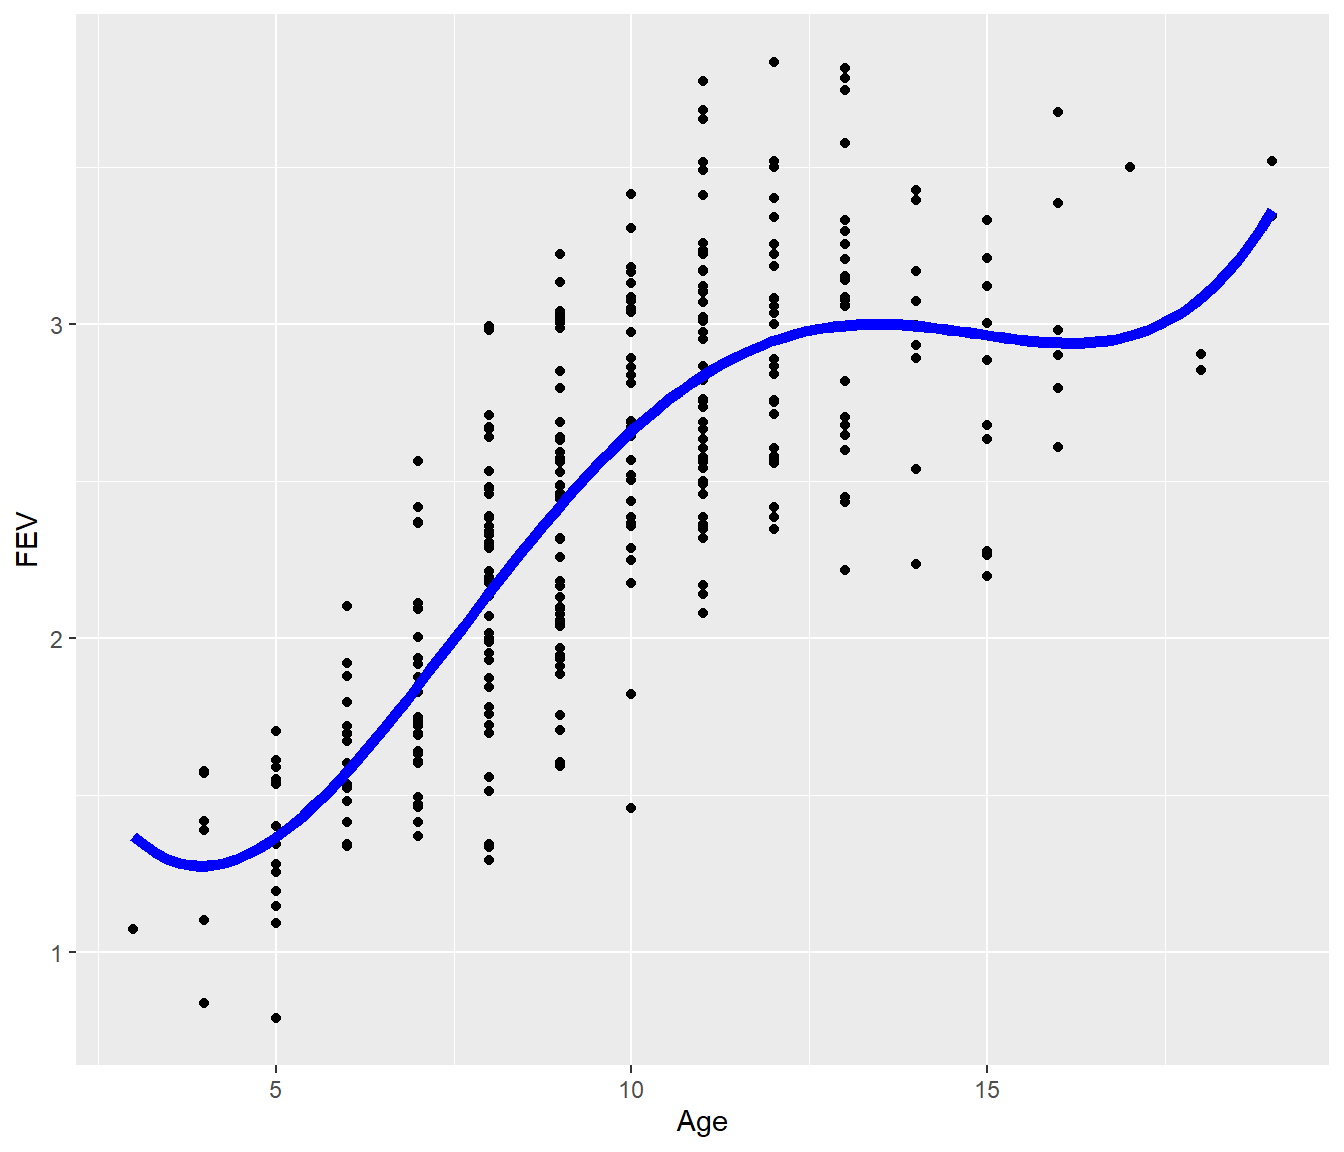
Polynomial Regression
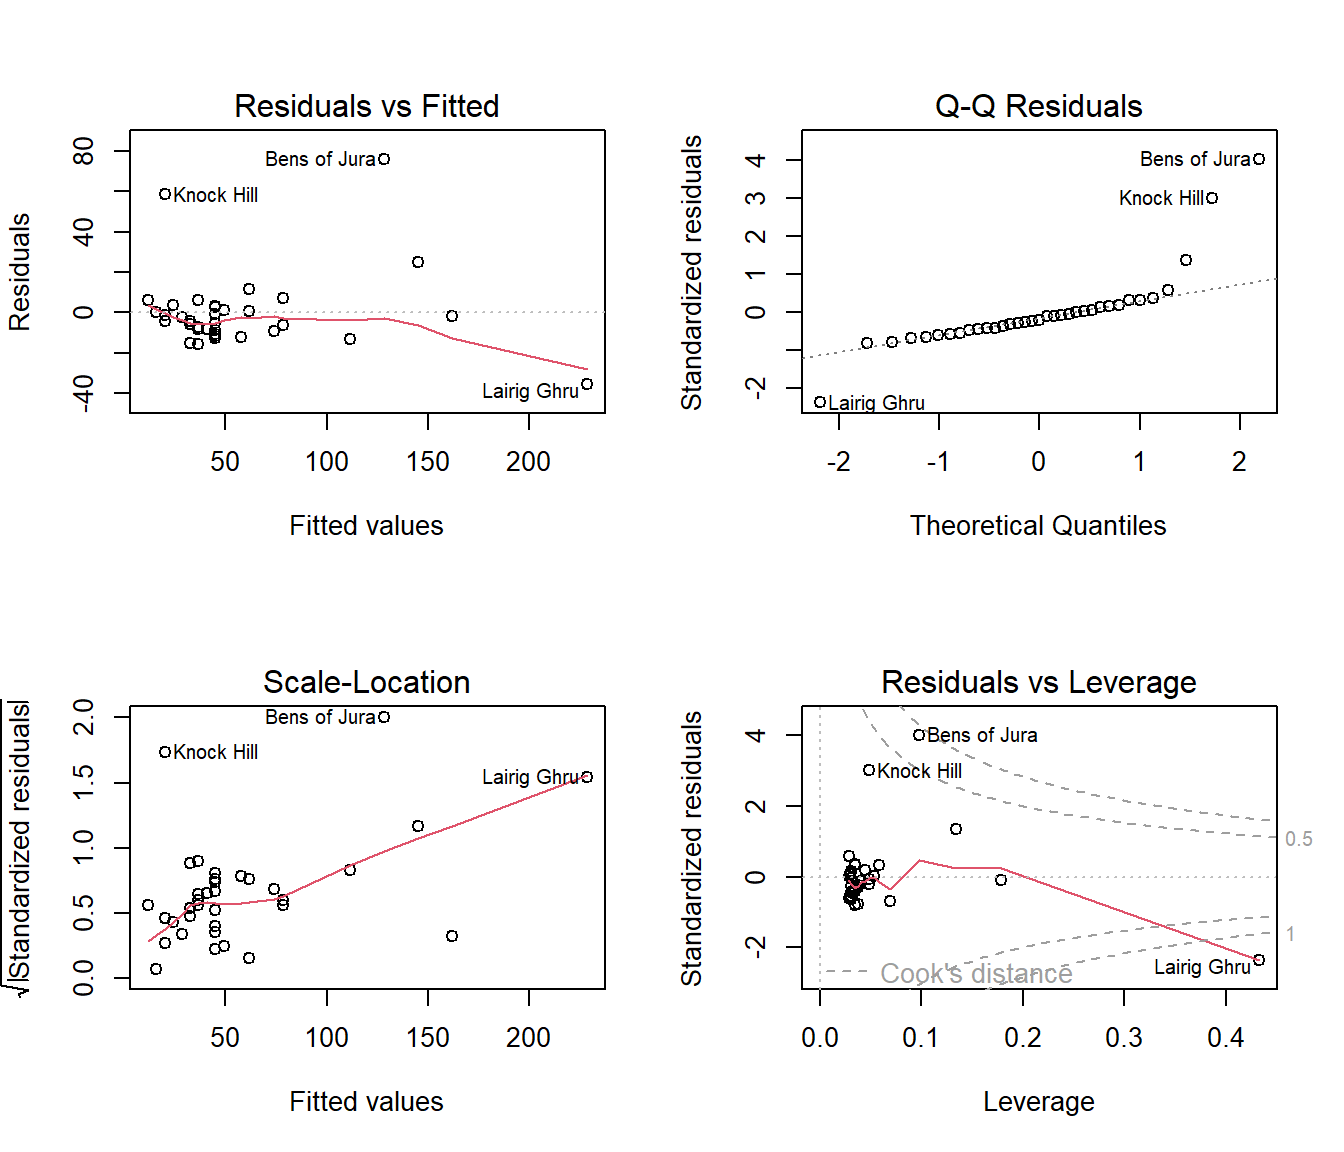
Model Diagnostic Plots
Regression for Grouped Data
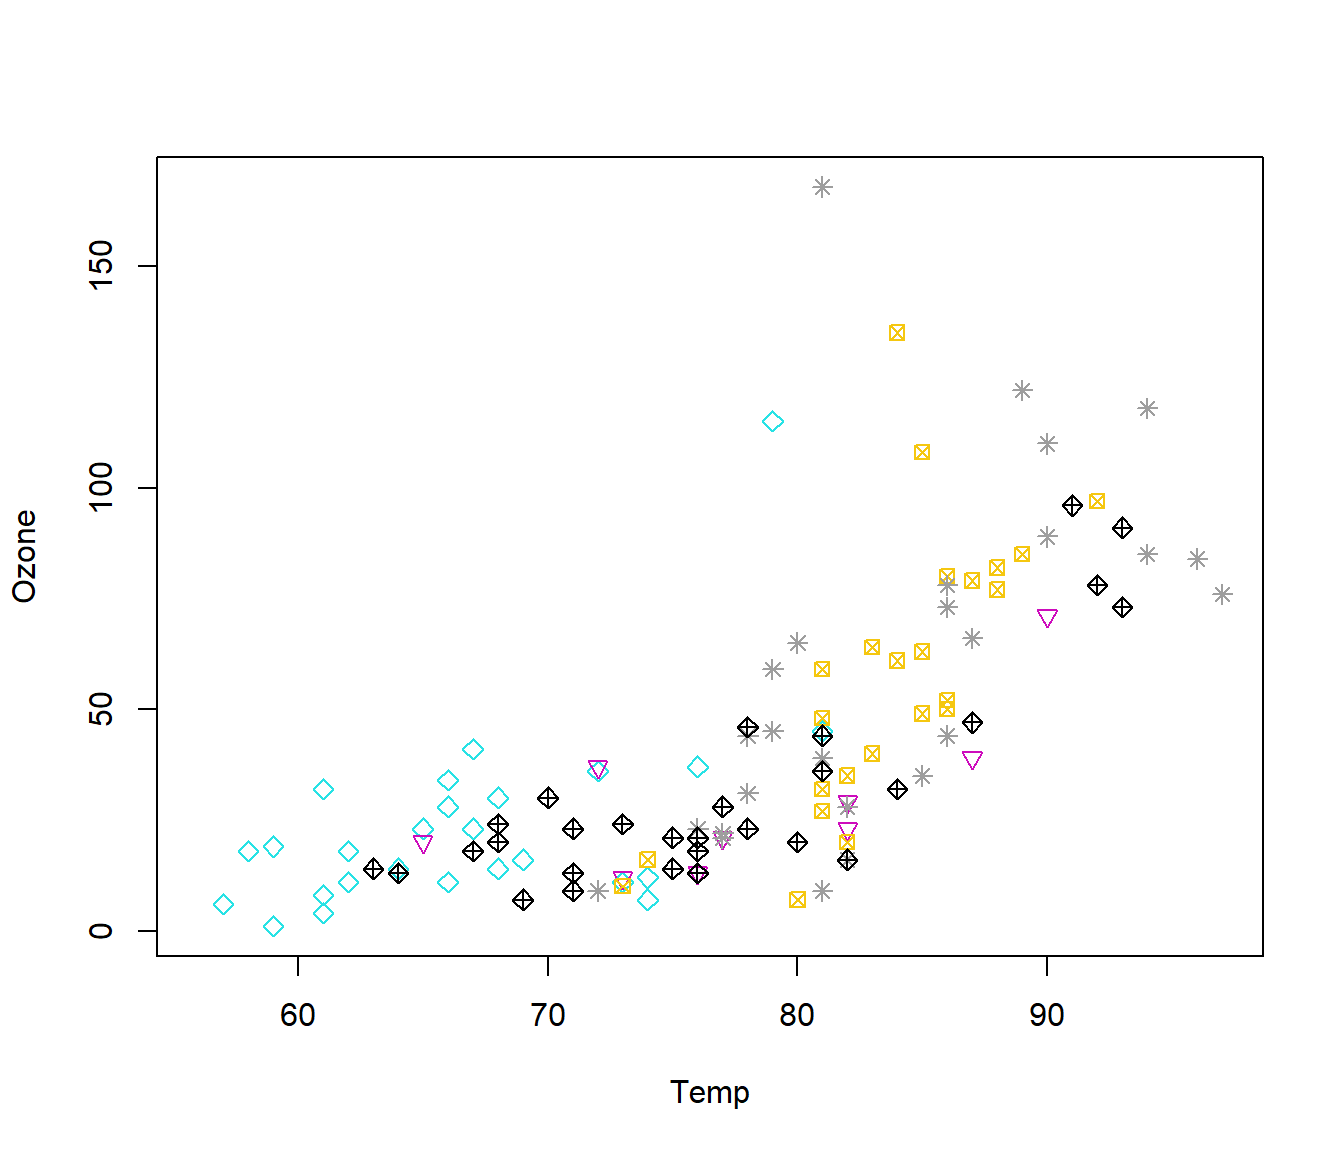
Figure 1.1: Ozone vs temperature for each of five months (May to September)
1.4 Computer Practicals
In practice, statistical methods are implemented on computers.
Doing statistical analyses helps you to understand underlying theory.
Computer practicals are therefore an essential element of 161.251.
Practical sessions will be held each week during semester. The more you put into the practical exercises, the more you will benefit from the opportunity to interact with staff.
Even if you miss the contact session, you should still work through the material on your own. You are most welcome to email for help.
1.4.1 161.251 Stream site
Check the Stream site for 161.251 on a regular basis for:
- links to lecture content and recordings
- Announcements and news. These will automatically be emailed to you so do make sure the correct email address is on your Massey profile.
- All study material. There is no set text to purchase.
- links to practical exercises; these are highly recommended
- Assignments and other assessment exercises, including the submission portal
- links to files for download.
- a record of interactions with staff and classmates
1.5 Assessment for 161.251
You will use R for all assessment exercises. Each of the first three (during semester) is worth 20% towards your final grade.
- Assessments 2&3: These are traditional assignments. You will write them using R markdown.
- Assessment 1: This has a time-constrained component like a traditional test, but it requires preparation like you would do for an assignment. There may be written questions where you will use output from work done prior to the test time. The focus is on showing understanding. You may be asked to deal with practical issues; for these questions you will demonstrate your ability to augment your analyses using R / Rmarkdown
You must allocate sufficient time to prepare for the test session; it cannot be completed at test time if you have not done any preparation.
The dates for Assessments 1-3 are on Stream; the fourth assessment date is determined by the Examinations Section and is conducted in the standard examination period. More on that later, but we know it is worth 40% of the final grade, and you must get 50% in that assessment exercise to pass the course.
We strongly recommend that you make use of R markdown via RStudio to complete as much work for the course as you can so that you are well versed in its use for the assessment exercises.
1.6 R markdown ?
If you have not used R markdown before, then you will need to gain some skill using it. The course lectures and other material were written using R markdown so we (indirectly) demonstrate its use. To help get you increasingly comfortable with R markdown, there are template files for almost all practical exercises.
You will soon find that R markdown is a huge time saver, especially for anyone who isn’t perfect (probably all of us).
1.7 Useful reference material
We believe we’ve provided everything you need within the provided course material. We do understand that you might want more, or to see different language used to discuss a particular topic. This is normal, and it is what many experienced academics do all the time. Referring to two sources really is a great way to confirm your understanding.
While we are keen for you to ask questions on Stream, sometimes people just want to look things up for themselves. Using Google might be what you prefer, but if you want a head start on looking for help in good quality references, take a look at the following options.
Linear Models with R by Julian J. Faraway presents some very nice examples and is a fairly easy read. Even though the second edition was released in 2014, the R code remains as useful today as it was at the time of writing. The data used in Faraway’s books are in the faraway package.
Introduction to Linear Regression Analysis (now in a sixth edition) by Montgomery, Peck, and Vining (often referred to as MPV) is a classic text. Its earlier editions were not aligned to any software, but the most recent editions are aligned to the two most widely used software options (R and SAS). There is an R package that includes a number of the datasets used in the (third edition of the) text, called MPV.
R for Data Science by Hadley Wickham and Garrett Grolemund, is a great resource. It has so much useful content that it could be used as a textbook for practically every undergraduate course in statistics and probably a few postgraduate courses as well.
If you’re wanting to take a deeper look at how and why different types of graphs are used, and why some are better than others, then read Fundamentals of Data Visualisation by Claus Wilke . Warning: this book goes well beyond what we expect you to think about in this course, but it is easy to read. It has great examples of using ggplot2 and provides discussions about how to choose appropriate graphs. Think of it as complementary to the course, not as recommended reading for the course. It might open your eyes to a greater range of graphics than you’ve used before.
The Graphics Cookbook by Winston Chang, has plenty of examples that can help you create presentation quality graphs of many types using the ggplot2 package. It might prove a slightly better option to consult if you already know what you are trying to achieve, but can’t recall how to do it. Everyone needs this sort of reference from time to time.
The R Markdown Cookbook by Yihui Xie, Christophe Dervieux, and Emily Riederer, should be one of the first refernces you seek when things aren’t going right with your R markdown documents. It will help you go from novice to power R markdown user if that’s what you want. Watch though that you don’t spend too much time making your R markdown documents more awesome than the situation deserves.
1.8 Use of Generative AI tools
Like many people, the staff teaching you in 161.251 like what Gen AI has to offer us. It can help us find answers to our problems and it’s great for finding problmes with our R code.
Using tools like ChatGPT is great for people who know when it is delivering useful responses. . It is not good for people who cannot see when it leads them astray, which probably includes many students.
You must limit your use of Gen AI though because we have to assess your work, not the Gen AI developers. You enrolled in this course to learn how to develop your statistical knowledge, not to become experts in relying on ChatGPT. Please be very careful to follow instructions set out for assessments, and the policies of Massey with respect to using Gen AI.
If you are unsure, please ask.
